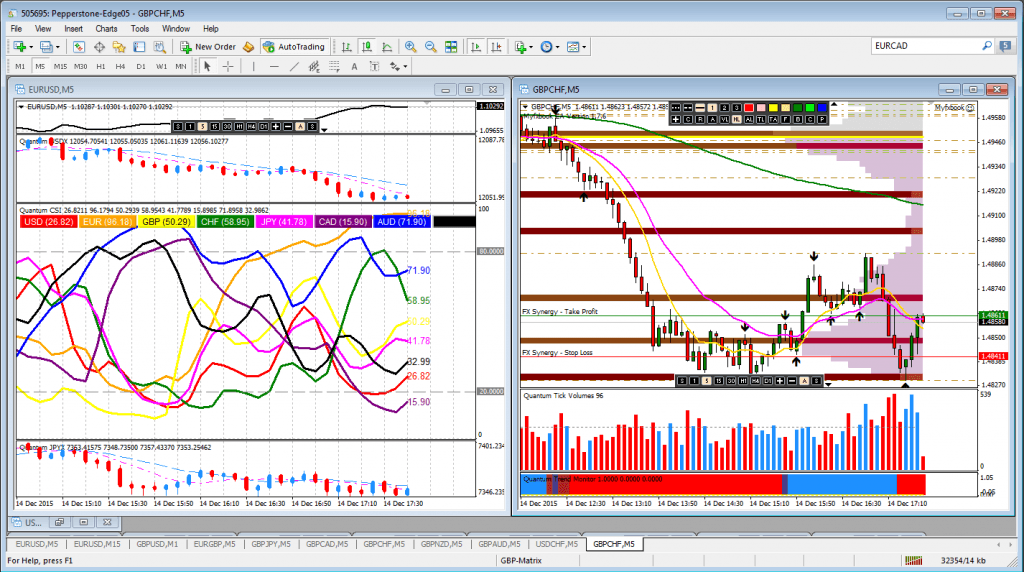
I just added a new indicator to my trading setup called the VPOC indicator. I do not believe in trading robots or the use of lots of indicators to “decide” for me when to open or close a trade. However, I use Japanese candlesticks to see the price-action and the market-movement information you can find in the candlesticks is for me a good start in my analysis of what the market is doing or to see potential. Some traders only display the candlesticks themselves on the chart and do not use any other indicator (read the book ‘Naked Forex‘ for more info. I personally believe that it helps to incorporate a few indicators on your trading screens as it simply makes things easier for you. A lot of indicators you can stick to your charts lag behind in time in relation to the price-action you see in the candlesticks themselves. This is due to their nature to summarize historical data. A 200 moving average (MA) indicator will need more time to move than a 9 moving average (MA) and both lag behind in time. Other indicators don’t lag in time (as much) such as e.g. the tick volume indicator. The candlestick itself on the chart is also not lagging behind in time. So be aware of what you stick on your chart and give it its proper supporting place in your trading setup.
VPOC stands for Volume Point of Control. This indicator has been developed by Quantum Trading to expand from a 2-dimensional Volume-Price-Analysis (VPA) approach to a 3-dimensional one. The tick-volume indicator gives you the trade volume in the market per candlestick. Over time you can see how the trading volume moves up or down as each candlestick is drawn on the chart. Is volume picking up or dying out. For substantial price movements to happen, you need substantial volume to support the price movement. If there is hardly any volume, the price will more likely not move a lot.
The spot-forex market is not centrally governed through an exchange other than the stock or futures market, so formally there is no official volume of trades known as it is simply not centrally registered at any exchange. The tick-volume is therefore the number of price movements during the buildup of the candlestick and gives more or less the same kind of indication of the volume or activity in the market.
The VPOC indicator is new to me. It displays the volume of price moves at the various price levels vertically on the right hand side of the price chart. For example, if over time the price has been in congestion, it has stayed at about the same price level and thus the volume of price movements at and about that price level is high. If on the other hand the price is moving out of a congestion phase and rising, the price doesn’t stay long at one price level while it is rising and over time. Thus the volume of price movement at and about that price level where the price passed through is low.
VPOC can be seen as an additional view or dimension to the VPA approach. The VPOC indicator shows those regions where volume is most intense, as well as those where volume is weak. This then creates the valleys and troughs of the volume profile with what they at Quantum Trading call High Volume Nodes and Low Volume Nodes.
In addition to displaying the volume density against price points as a histogram on the chart and painting the VPOC level based on this analysis, the indicator also highlights the volume nodes outlined above which then define support and resistance regions above and below the VPOC.
There where the price is in congestion, the VPOC indicator will show a High Volume Node and there where price is moving up or down and not staying there in that region, the VPOC shows a Low Volume Node.
It seems that the VPOC indicator was developed for trading screens with a black background. I changed the parameters and settings of the indicator to display well on the white background of my trading screens as well.
The below video from Quantum Trading that gives you a good overview of the VPOC indicator and what information it will give you.
